Writing this article is frustrating in its own way—because it shows how closely progress and failure often go together. Electricity powers nearly every part of modern life, from the lights above us to systems we barely think about. But behind that convenience lies a long and often overlooked history of breakdowns, missteps, and hard-earned lessons.
What stands out is how easily safety can be taken for granted—how routine, ambition, or simple trust in the system can hide growing risks. Progress is essential, but it’s never free. Its real cost often surfaces only after systems break, when the silence sets in.
This isn’t just about what went wrong, but about how we respond—what we learn, change, and choose to remember. Because in the end, reliability isn’t something we inherit. It’s something we build, again and again.
The 1965 Great Northeast Blackout
Power grids are built to be reliable—but in 1965, one small failure showed just how connected and fragile these systems can be. It’s like when one fuse blows in your house and suddenly multiple appliances stop working. In larger systems, the same principle applies—a tiny fault in one area can cause a much bigger problem across the network.
The Great Northeast Blackout of 1965 started with a broken relay at a station near Niagara Falls. It triggered a chain reaction during peak demand, knocking out power across 80,000 square miles in the U.S. and Canada. The outage lasted up to 13 hours, affecting 30 million people, and caused damages of about $100 million—roughly $950 million in today’s money.

This event got me thinking about how one small issue can lead to massive consequences—and how we can learn from it.
Why Did It Start So Small?
The root cause was a single malfunctioning relay. It was supposed to protect the power lines from overloading, but it failed. That caused electricity to reroute through other lines, which couldn’t handle the extra load. Since the grid was highly interconnected, the failure spread fast.
Back then, systems weren’t as smart as they are today. From my own visits to power plants, I’ve seen how operators now keep a close eye on relays and have better tools to respond. But in 1965, the blackout spread in minutes—hitting Toronto first, then New York by 5:27 PM. People got stuck in elevators. Hospitals had to switch to generators. No one died directly, but the incident revealed big flaws in how regions shared power.
How Did It Affect Daily Life?
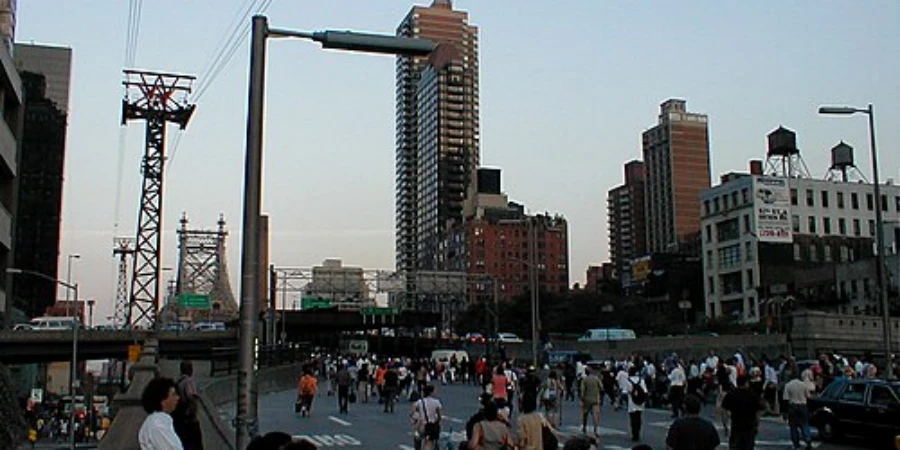
Picture rush hour with no traffic lights or subways. In New York alone, 800,000 people were trapped underground. Planes were grounded. Factories stopped. I once watched a video about a retired lineman who was in Boston that night—he remembered people helping each other using candles and battery-powered radios.
The economic loss was big for such a short event: spoiled food, missed wages, and production delays all added up.
| Aspect | Details |
|---|---|
| Affected Area | 80,000 square miles |
| People Impacted | 30 million |
| Major Disruptions | Subways stopped, airports closed |
| Power Restored | 4 to 13 hours in most places |
This table gives a clear picture: even short blackouts need serious backup plans.
What Changed After?
In response, the U.S. and Canada formed the North American Electric Reliability Corporation (NERC) in 1968 to set safety and reliability standards for power grids.
This event also pushed for automatic systems that isolate issues before they spread. Even today, especially with climate-related risks, experts still reference this blackout when pushing for infrastructure upgrades.
At a recent conference, someone said it best: “Interconnected grids are strong—but only if we keep checking them.” If you work in this space, think about how your own projects connect to the bigger picture. Small fixes can prevent big failures.
The 1977 New York City Blackout
Heatwaves push power grids to their limits—and in 1977, one lightning strike showed how quickly a city can go dark. Events like this tell us how even a single failure, if not controlled, can cascade through an entire system.
The New York City Blackout of 1977 began when lightning hit key transmission lines. The local utility, Con Edison, couldn’t reduce load quickly enough, and by 9:36 PM, the grid collapsed. The outage lasted 25 hours, affected 9 million people, triggered over 1,000 fires, led to 3,776 arrests, and caused an estimated $300 million in damage—around $1.5 billion today.

Stories of what happened socially always raise questions about both technical vulnerabilities and how people react when systems fail.
What Triggered the Failure?
Lightning struck power lines north of the city during a heatwave, when demand for air conditioning was very high. The system failed to balance the load, and without fast automatic breakers, the failure spread quickly.
Back then, operators had to manually control the grid, which was slower. The blackout hit poorer neighborhoods hardest, increasing social tensions which is already high from economic difficulties.
How Bad Was the Unrest?
Soon after dark, looting broke out. Stores were damaged and many fires were set. Emergency services were overwhelmed trying to respond. Over 1,600 businesses suffered damage. While no deaths were directly caused by the power loss, injuries rose during the chaos.
| Impact Type | Numbers |
|---|---|
| Fires | 1,037 |
| Arrests | 3,776 |
| Looted Stores | 1,616 |
| Economic Loss | $300M (1977) |
Lessons for Urban Grids
After the blackout, ConEd improved its system by automating load shedding and enhancing communication. Modern grids now include planning for social effects too, such as backup power for critical water pumps.
New York City’s emergency plans have evolved based on this event. The blackout showed that power failures are not just technical problems—they affect entire communities. Effective solutions must combine technology upgrades with public preparedness and trust.
For anyone working in power or urban infrastructure, the lesson is clear: fixing technical issues is critical, but planning for human impact is equally important.
The 2003 Northeast Blackout
Overgrown trees may seem minor—but in 2003, they helped trigger one of the largest blackouts in North American history. It was a clear example of how overlooked maintenance and software flaws can bring down entire systems.
The Northeast Blackout of 2003 started in Ohio when power lines sagged into untrimmed trees, causing circuits to trip. A software bug then failed to alert operators, allowing the issue to spread. The result: more than 100 power plants shut down, affecting 55 million people across eight U.S. states and Ontario. Some areas lost power for up to four days, with about 11 indirect deaths and $6–10 billion in economic losses.
This blackout is a powerful reminder of how even local problems can have international consequences.
How Did It Unfold?
During a hot summer day, increased electricity demand caused power lines in Ohio to sag. Some of those lines came into contact with trees—something regular trimming could have prevented. At the same time, a software failure in the control room disabled alarms, so operators didn’t realize what was happening.
As a result, power rerouted and overloaded other parts of the grid, eventually knocking out electricity across New York, Detroit, and Ontario. Today, vegetation management and real-time monitoring are standard industry practices to prevent such problems.
What Were the Immediate Effects?
The effects were widespread:
-
Water systems failed due to pump shutdowns.
-
People were stranded in elevators and subways.
-
Airports closed, disrupting travel.
-
Businesses lost millions in productivity and spoiled goods.
Some areas managed with battery-powered lighting and backup systems. In this case, we can see the value of simple emergency preparedness.
| Category | Stats |
|---|---|
| Power Plants Offline | 508 generating units |
| Indirect Deaths | ~11 |
| Economic Cost | $6–10 billion |
| Regions Affected | 8 U.S. states, Ontario |
This table gives a clear picture of how widespread the damage was.
What Changed Afterward?
Following the event, the NERC mandated strict vegetation management and improved reliability standards. These reforms significantly reduced the chances of similar failures.
The blackout also showed the importance of cross-border cooperation, especially between the U.S. and Canada, and emphasized the role of software in grid reliability. Monitoring tools and automatic alerts are now essential for preventing outages like this.
For anyone involved in electrical infrastructure, the lesson is clear: maintenance, monitoring, and modern software tools are just as critical as hardware. The 2003 blackout became a turning point—leading to safer, more resilient power systems today.
The 2012 India Blackout
High electricity demand can push any grid to its limits—and in 2012, India became a global case study in how extreme weather and system overloads can lead to huge failure. I witnessed a similar, though smaller, demand spike during a supplier event in a heatwave; it nearly overwhelmed us until systems stabilized. Spotting early signs like that can prevent disaster.
On July 30 and 31, 2012, India experienced one of the largest blackouts in history. Triggered by weak monsoons reducing hydroelectric output and compounded by overloaded transmission lines and poor interregional coordination, the failure left 620 million people across 22 states without power for up to 15 hours. The outage removed 32 GW from the grid and caused an estimated $1.5 billion in economic losses.

Its massive scale continues to stand out globally, offering important insights into failure causes and system resilience.
What Set Off the Collapse?
Late monsoon rains had already lowered hydroelectric capacity. At the same time, intense heat increased electricity demand—especially for air conditioning. When a 400 kV transmission line tripped, there wasn’t enough load shedding to compensate. The northern grid collapsed first, followed by the eastern as the stress cascaded.
From chats I’ve had with international colleagues, India’s grid at that time was fragmented into loosely connected regions. On July 30, power was lost for about 400 million people. By the following day, the number had surged to 620 million. Over 300 trains stalled, Delhi’s metro shut down, and hospitals had to rely on emergency generators. While no deathes were directly reported, 200 miners were trapped temporarily and later rescued safely. Daily life was stoppped for half the country.
How Did It Hit the Economy and People?
The blackout shut down factories, stopped businesses, and disrupted supply chains. The $1.5 billion in losses came from missed work and spoiled food. In the countryside, farms were hit hard because electric water pumps stopped working.
In cities, people used candles and backup lights—something I’ve dealt with during smaller outages. The heavy use of generators during the blackout also made air pollution worse. One study found that in places like Delhi, NO₂ levels went up by 0.4% every hour during the outage.
| Key Figures | Details |
|---|---|
| People Affected | 620 million |
| Power Lost | 32 GW |
| States Impacted | 22 |
| Restoration Timeline | By August 1 |
What’s Changed Since?
By 2024, India successfully managed a peak demand of 250 GW without major incidents—thanks to system upgrades, stronger grid interconnectivity, and over $33 billion in infrastructure investment.
A 2025 analysis suggests that a similar blackout today would be far more damaging due to the economy’s growing reliance on stable electricity supply.
India’s recovery involved the implementation of smarter load controls, improved demand forecasting, and increased integration of renewable energy to reduce dependence on hydroelectric sources. Weather modeling, particularly for monsoon-related variability, became a key part of planning and risk management.
Today, large-scale outages like the 2012 blackout are rare, with nationwide blackout frequency reportedly reduced by 70%. The transformation shows how timely and strategic investment can significantly strengthen grid resilience within a decade.
The 2021 Texas Power Crisis
Extreme cold can overwhelm power grids, especially ones that stand alone. In February 2021, Winter Storm Uri showed serious problems in Texas’s power grid. When temperatures dropped below freezing, the grid couldn’t handle the extra demand for heating.
From February 13 to 17, gas wells and wind turbines froze, causing power outages across Texas’s ERCOT grid. About 4.5 million homes lost power. The storm caused at least 246 official deaths, with some estimates as high as 700, and caused around $195 billion in damage.

Why Did the Grid Buckle?
Winter Storm Uri brought record-low temperatures across Texas. Natural gas pipelines and wind turbines froze, and electricity demand spiked as people turned up the heat. The grid lost about 46,000 MW gas and 3,000 MW wind power.
Because ERCOT is not well connected to other U.S. grids, Texas couldn’t import electricity from neighboring states. Rolling blackouts quickly turned into multi-day outages in some areas.
At the time, many energy facilities were not weatherproof, as protection against extreme cold was not widely required or enforced.
Human and Financial Impact
Many people died from hypothermia and CO poisoning from generators. Official deaths were 246, but some studies say it could be up to 700.
Water pipes broke for 14 million people, and health problems increased. The economic cost was about $195 billion, including lost business and property damage.
Many families in Houston stayed warm by layering clothes and making the most of limited resources — a true example of resilience during the crisis.
| Factor | Data |
|---|---|
| Homes Without Power | 4.5 million |
| Estimated Deaths | Up to 700 |
| Total Cost | $195 billion |
| GDP Impact | At least 1.44% drop |
What Has Been Done and What’s Next?
Texas has weatherized over 1,500 sites and plans to add 20 GW of renewable energy by 2025.
However, many experts say Texas still needs better connections with other states, as little progress was made by 2022.
Recent studies estimate that the crisis lowered GDP by 1.44%, we can learn how critical reliable power is for the economy.
For those studying energy systems, a key lesson is to diversify power sources—combining gas, wind, and solar. As of 2025, ERCOT conducts more frequent system tests, but the risk of isolation remains. It’s a reminder that climate must be part of how we design energy systems.
Conclusion
Power grids are vital but fragile. Each blackout taught us to build stronger, smarter systems. Reliable electricity requires ongoing investment, planning, and adapting to change. Safety and resilience come from learning and improving continuously.
Learn from History, Invest in Reliability
A single faulty component can bring down a grid. Don’t let that component be yours. Choose circuit protection that stands the test of time.